This is Why You Should Setup Monitoring For Your Project
What Even is Monitoring?
Monitoring is a way to, monitor our apps. Specifically, it's a way for us to evaluate how our application is doing and highlights areas in which we can improve our applications in the future.
Backend Monitoring
What can we monitor in the backend side?
- Resource usage. How our backend is using CPU, network, and RAM.
- Performance. How fast our endpoints are.
- Errors. What errors the users are facing when interacting with the app.
1. Resource Usage
Thankfully, our platform for deploying our backend, Railway, provides us with the stats relating to resource usage.
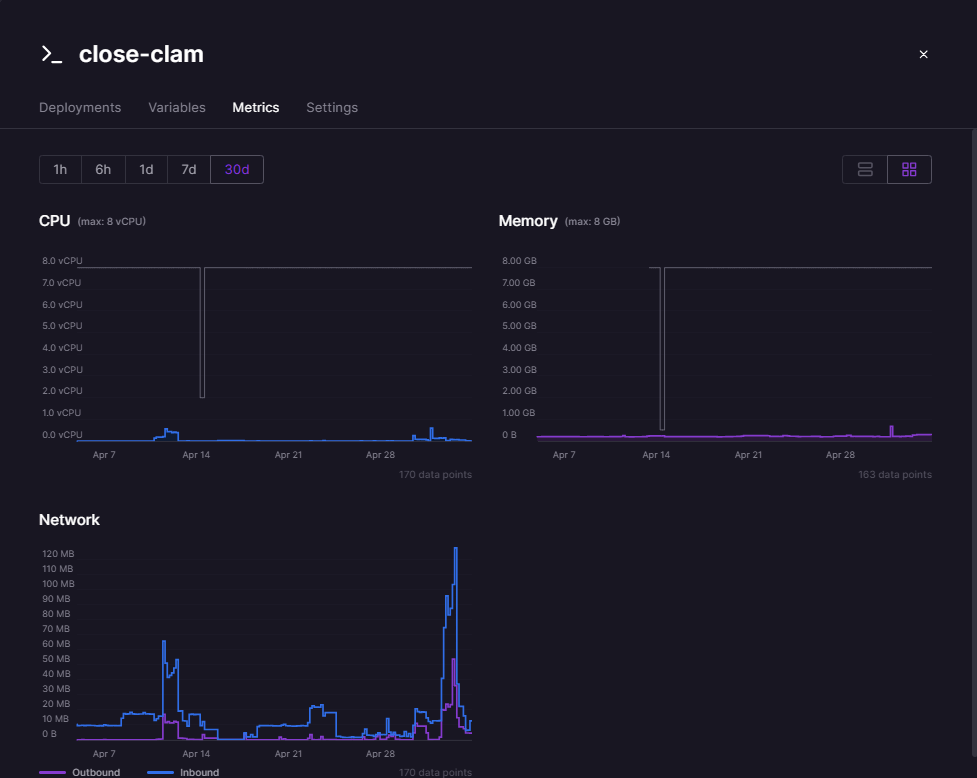
Railway not only provides metrics for the backend, but also for the database (PostgreSQL), Redis instance, and Typesense (before we decided to replace Typesense with another solution).
We used this feature to detect some memory leaks, as our Railway credits were used in an abnormal rate. The credits were running out too fast with minimum hit rate towards the backend. Using the metrics given, we found out that Typesense was the one that ate a lot of our memory, and this was the root cause of the abnormal rate. Without these metrics, it would be really difficult for us to determine what was going on.
2. Performance
Our team set up Open Telemetry and Honeycomb for this purpose.
We first needed to create an account in Honeycomb and obtain the HONEYCOMB_API_KEY and HONEYCOMB_SERVICE_NAME.
Once that's done, to setup Open Telemetry with Honeycomb, we needed to instantiate the HoneycombSDK:
// tracer.ts
import { ExpressInstrumentation } from '@opentelemetry/instrumentation-express';
import { HttpInstrumentation } from '@opentelemetry/instrumentation-http';
import { NestInstrumentation } from '@opentelemetry/instrumentation-nestjs-core';
import { HoneycombSDK } from '@honeycombio/opentelemetry-node';

const otelSDK = new HoneycombSDK({
  apiKey: process.env.HONEYCOMB_API_KEY,
  serviceName: process.env.HONEYCOMB_SERVICE_NAME,
  instrumentations: [
    new HttpInstrumentation(),
    new ExpressInstrumentation(),
    new NestInstrumentation(),
  ],
});

export default otelSDK;
We'll use the otelSDK here:
// main.ts
import otelSDK from './tracer';

async function bootstrap() {
  if (process.env.NODE_ENV !== 'local') {
    await otelSDK.start();
  }

  ...

  await app.listen(process.env.PORT || process.env.APP_PORT || 3001);
}
bootstrap();
We'll start the OpenTelemetry SDK on our app startup code.
And after we access the backend endpoints, the events would then be captured and shown in the Honeycomb dashboard:
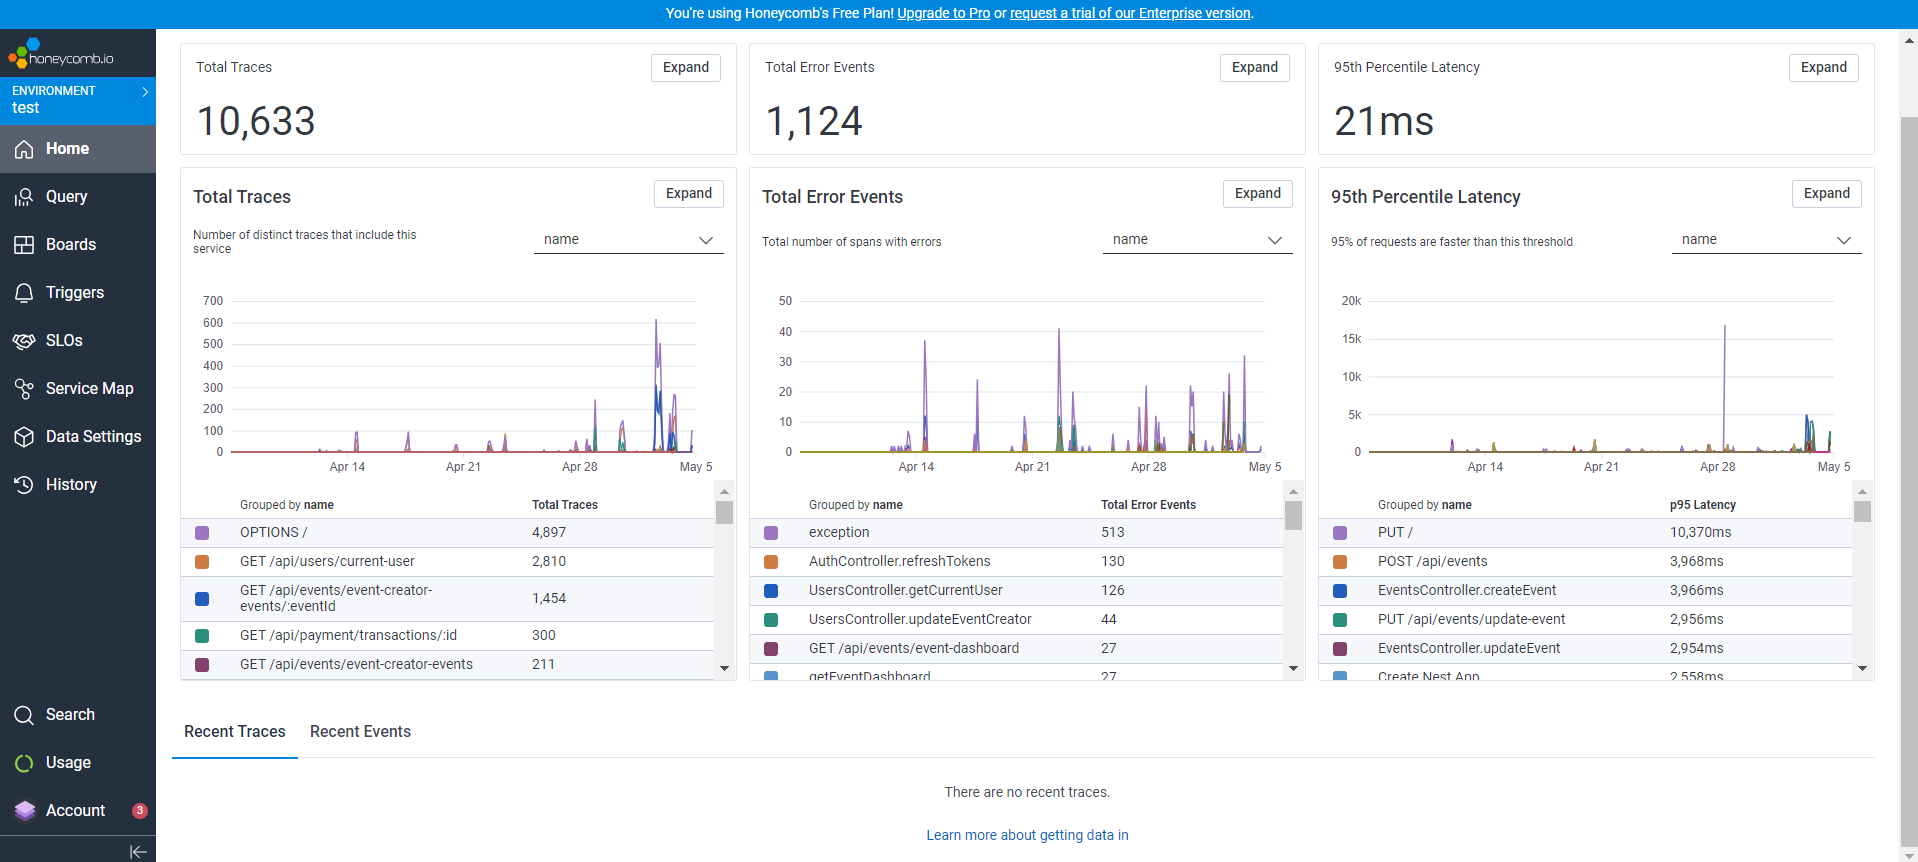
We can go even further. The data that Honeycomb shows is very thorough in my opinion. We can also see the trace of each endpoint:

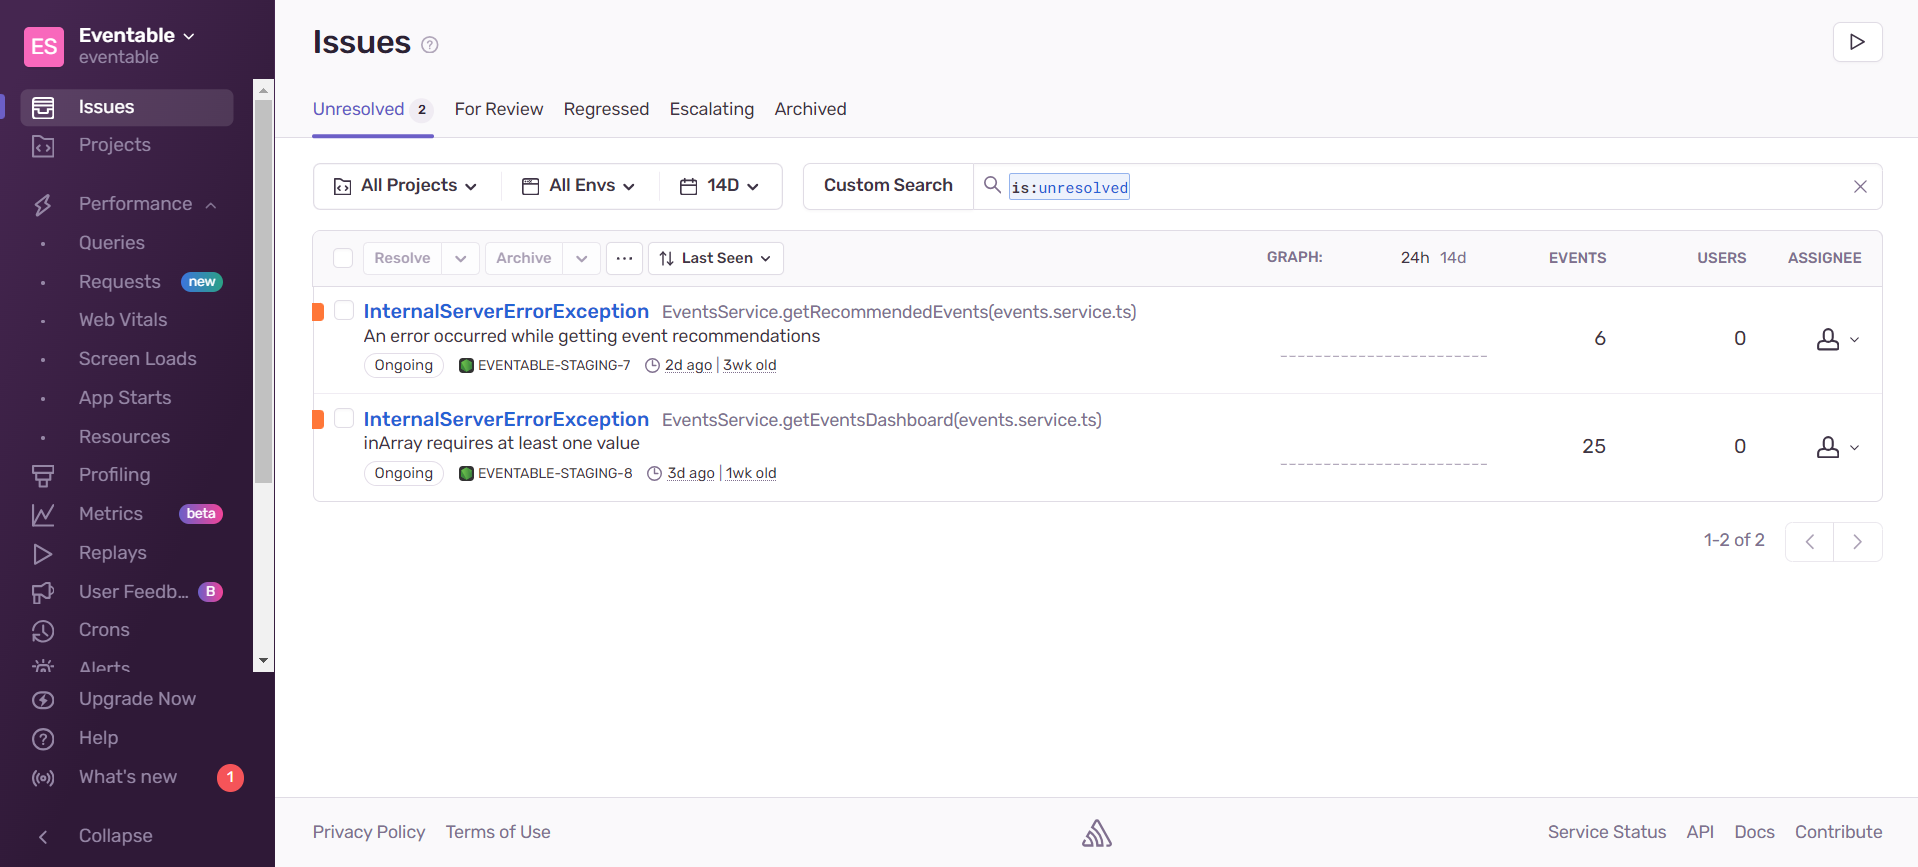
We could go further! Honeycomb also shows error events and show their traces:

These traces are really useful to detect slow endpoints and also endpoints that are currently returning errors.
3. Errors
Open Telemetry and Honeycomb may show good data regarding errors, but Sentry's error trace is also insightful. We can also integrate Sentry notifications to a Discord, which we did to help notify us about urgent errors as soon as possible.
We first need to create a Sentry account and Sentry project to obtain our SENTRY_DSN.
Next, we need to set Sentry in the same place where we set up Open Telemetry:
// main.ts
import * as Sentry from '@sentry/node';

async function bootstrap() {
  if (process.env.NODE_ENV !== 'local') {
    Sentry.init({
      dsn: process.env.SENTRY_DSN,
    });
  }

  ...

  await app.listen(process.env.PORT || process.env.APP_PORT || 3001);
}
bootstrap();
Now we need to setup so that if there is an urgent error, Sentry must capture that exception:
// http-exception.filter.ts
import {
  ArgumentsHost,
  Catch,
  ExceptionFilter,
  HttpException,
  HttpStatus,
} from '@nestjs/common';
import * as Sentry from '@sentry/node';

@Catch(HttpException)
export class HttpExceptionFilter implements ExceptionFilter {
  catch(exception: HttpException, host: ArgumentsHost) {
    ...

    if (statusCode >= 500) {
      Sentry.captureException(exception);
    }

    ...
  }
}
Why only >= 500 errors? We decided that 500 errors are the most urgent errors to be captured by Sentry. Other than that, we want to save some capturing quota, since we're using Sentry's free plan.
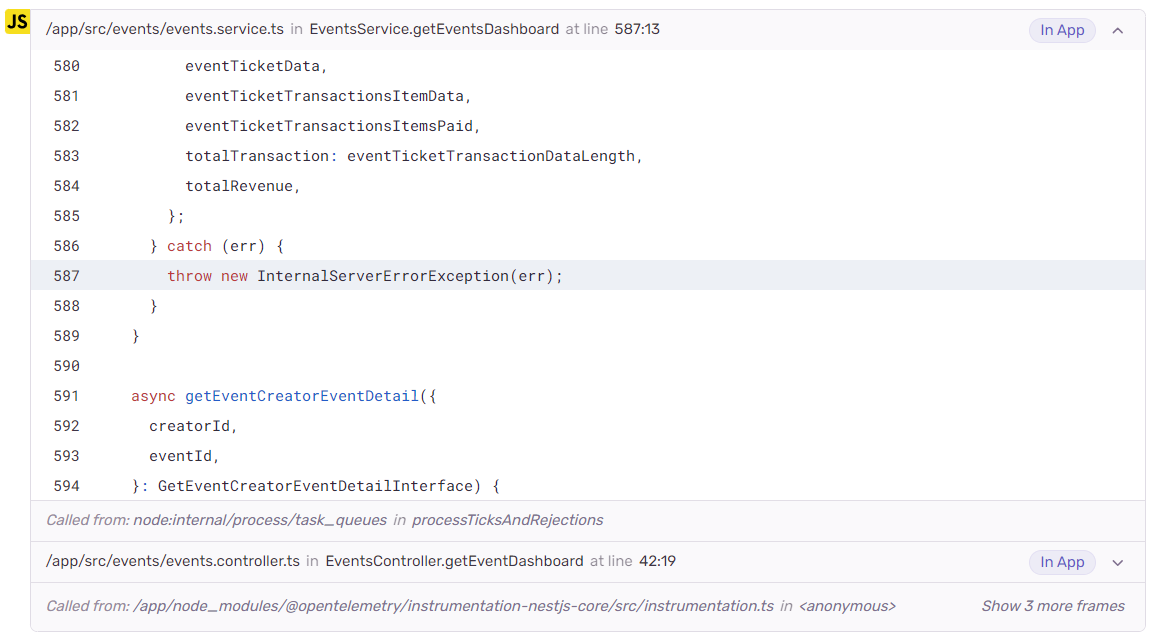
Once we set up all this, we should be able to see the results, should Sentry catch some errors.
We get the details of the event:
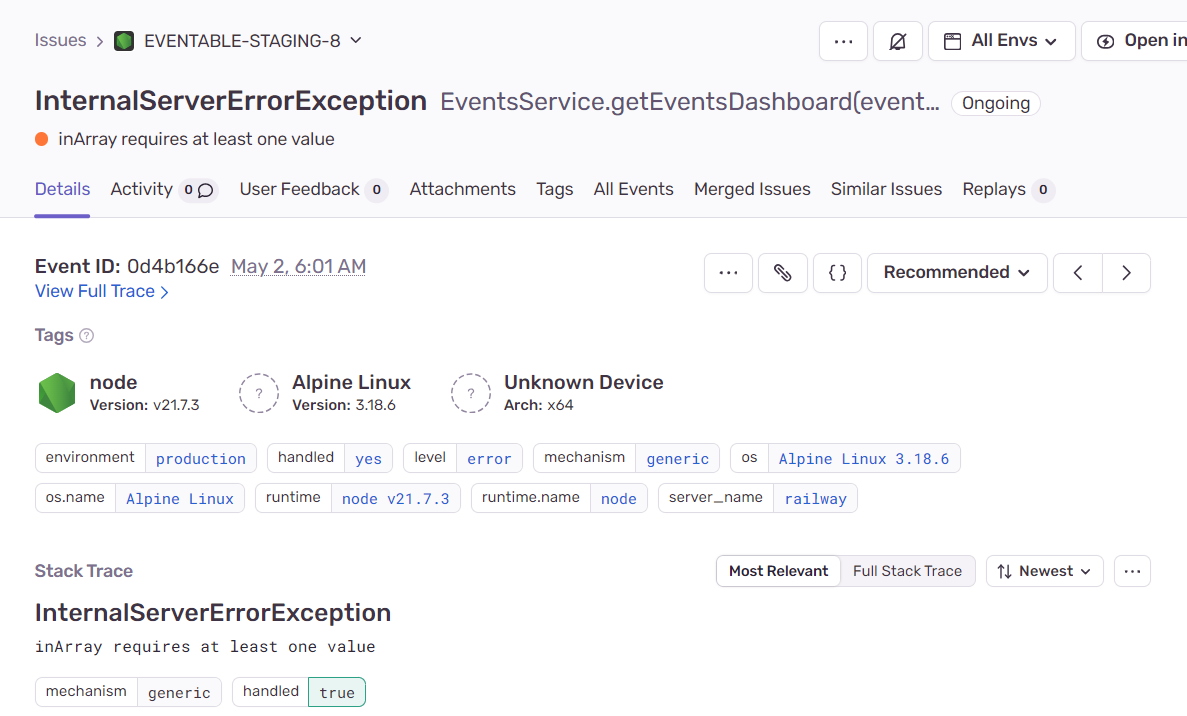
as well as the stack trace:
Sentry can also be integrated with Discord, which we did:

This is so that our team is notified whenever there are abnormal errors (which are errors that have an error code of 500 or greater).
Frontend Monitoring
Vercel can provide really useful insights for our frontend application. But we need to set up some stuff beforehand (it's surprisingly easy!).
export default function RootLayout({
  children,
}: Readonly<{
  children: React.ReactNode;
}>) {
  return (
    <html lang="en">
      ...
      <body className={`${inter.className}`}>
        <AuthProvider>
          ...
          <Analytics /> // for web analytics
          <SpeedInsights /> // for speed statistics
        </AuthProvider>
      </body>
    </html>
  );
}
By just adding those two components, Vercel will show analytics and speed data for our app. How cool!
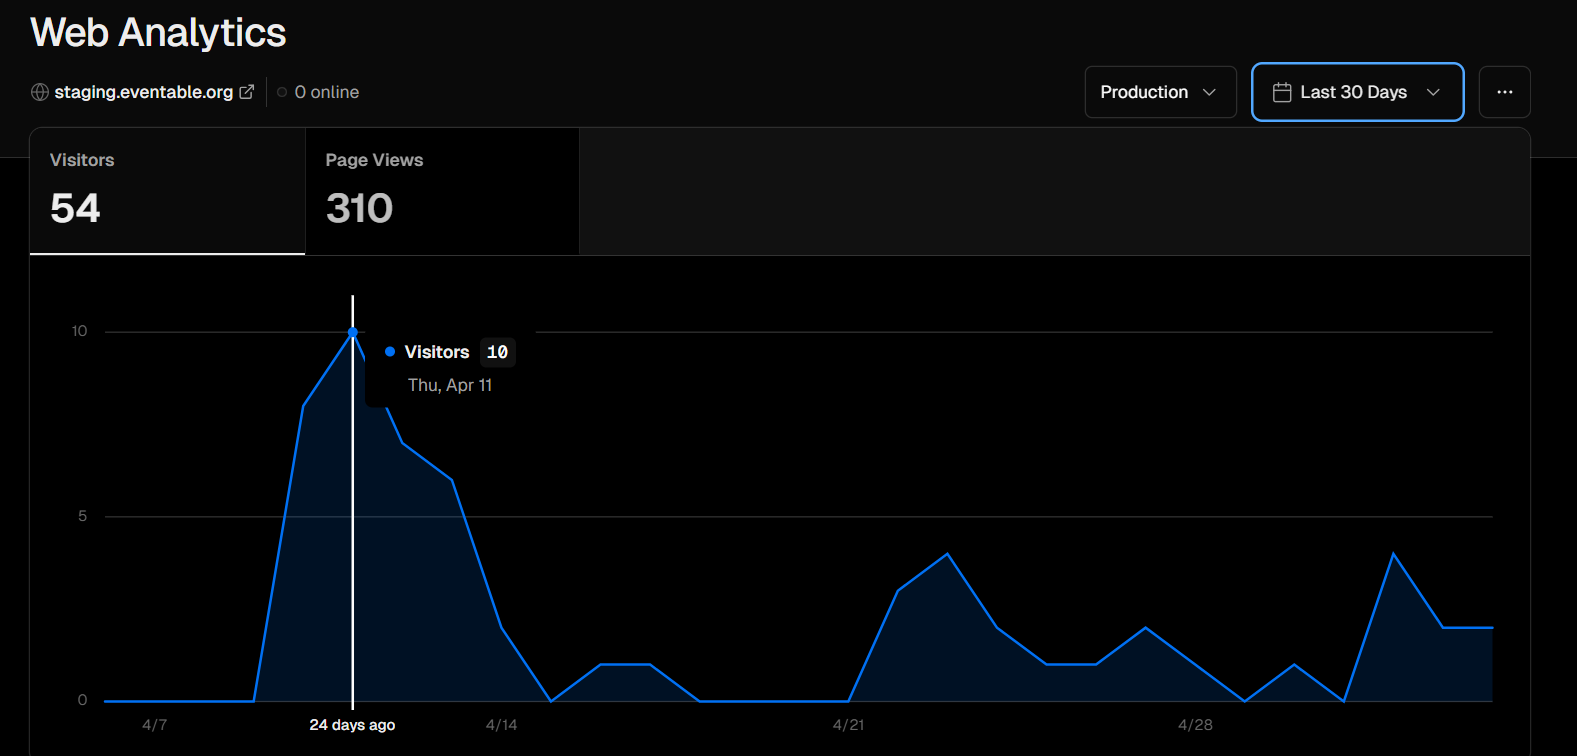
1. Analytics
We get to know about our page visitors and page views:
We also get to know which pages users view the most, referrers of our app, countries that the users are from, operating systems used to use our app, and browsers used to access our app:
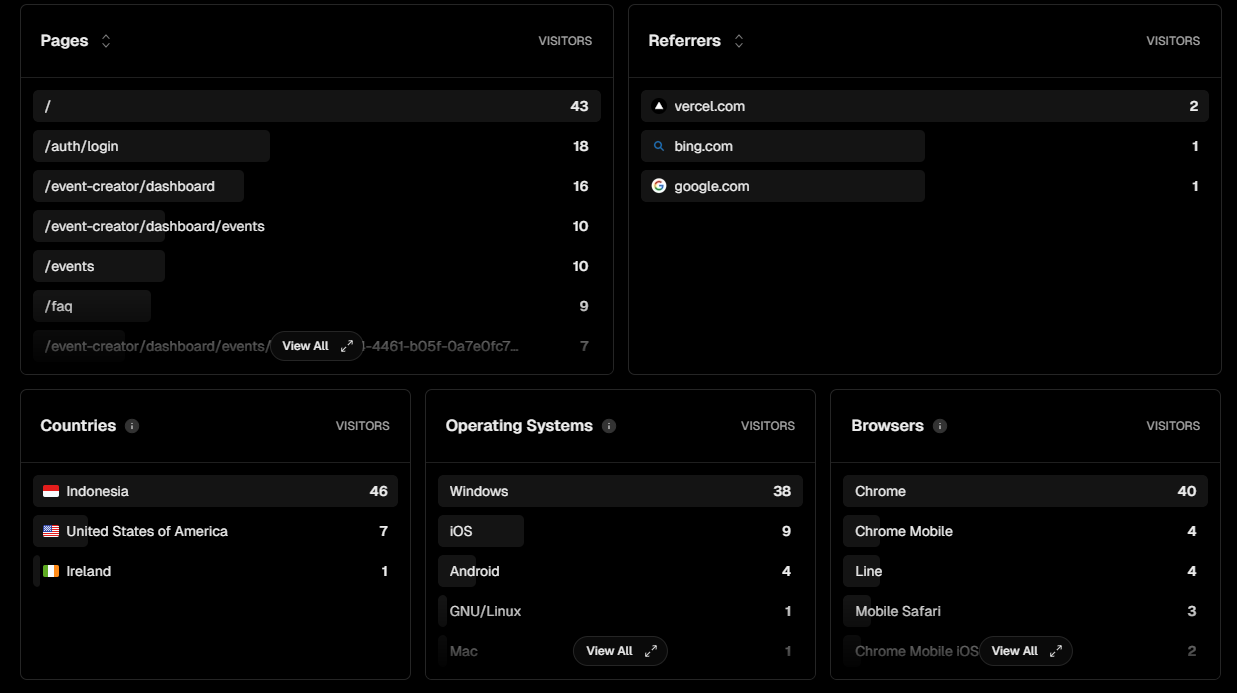
These insights are really insightful for us to see how our app is performing.
2. Speed
Speed is equally important in the frontend side. Thankfully, Vercel also gives us speed-related data:

These stats are really helpful for our team to detect page which routes are performant and which routes need optimizing.
Conclusion
Backend and frontend monitoring is so useful to make our apps better for our users. Open Telemetry, Honeycomb, Sentry, and Vercel Analytics really help our team to get these insightful data and help us improve our app.